
Orijen vs Taste of the Wild

Orijen against Taste of the Wild, measured across 14 and 16 kibble recipes: 38.9% vs 28.8% protein and 20% vs 35% starch, as fed.
How They Differ
- Orijen runs higher in protein: 38.9% against 28.8% as fed, averaged across the kibble we review from each.
- Orijen is lower in starch, about 20% of the food as fed against 35%.
- Orijen is more calorie dense, 459 kcal per cup on average against 412, so its portions run smaller for the same dog.
Side by Side
Protein and fat:
| Measure | Orijen | Taste of the Wild | Average kibble |
|---|---|---|---|
| Kibble recipes compared | 14 | 16 | 1,742 in total |
| Protein, as fed | 38.9%38.0% to 42.0% | 28.8%25.0% to 32.0% | 27.2% |
| Fat, as fed | 16.9%13.0% to 20.0% | 16.1%15.0% to 18.0% | 14.4% |
| Starch, as fedEstimated, not measured. It is what is left of the guaranteed analysis once protein, fat, fiber and moisture are taken out, with ash assumed at 6%. That leftover is mostly starch but also carries sugars and the fiber a crude-fiber test misses, so read it as a close estimate rather than an exact figure. Measured as fed, the same basis as the bag. | 20%11% to 24% | 35%30% to 41% | 37% |
| Calories per cup | 459401 to 494 | 412360 to 445 | 398 |
| Meat, fish or egg listed first | 93% | 100% | |
| Grain-free recipes | 79% | 75% | |
| Most used proteins | Fish 100%, Chicken 64%, Turkey 64% | Fish 63%, Egg 56%, Lamb 44% | |
| Recipes with corn, wheat, soy | Corn 0%, Wheat 0%, Soy 0% | Corn 0%, Wheat 0%, Soy 0% | |
| By-products | 0% | 0% | |
| FDA recalls, last 5 years | None | None1 older in the archive | |
| Made by | Champion Petfoods | Diamond Pet Foods |
Brand figures are averages over every kibble recipe we review from that brand, with the lowest and highest recipe underneath. Freeze-dried, frozen, wet food and toppers are left out so the numbers compare like with like, and so are prescription diets, which are fed for a medical condition on a vet's advice. Everything is as fed, the way the bag prints it; the switch above the table shows protein and fat on a dry matter basis instead, which takes the water out so foods of different moisture compare evenly. Why we use as fed.
The Closest Matching Recipes
Brand averages hide the recipe you would actually buy. These are the pairs that come closest on protein, fat and starch, preferring recipes built on the same main protein, which is where a like-for-like choice gets made.
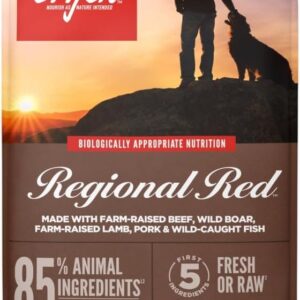
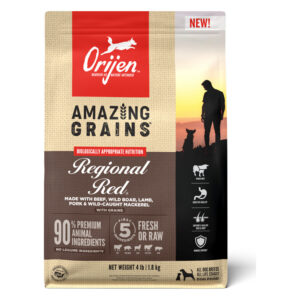 Orijen Amazing Grains, Regional Red Dry Dog Food
Protein 38%
Fat 18%
Starch 22%
Orijen Amazing Grains, Regional Red Dry Dog Food
Protein 38%
Fat 18%
Starch 22%
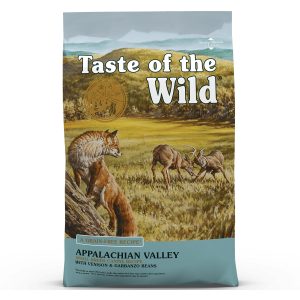 Taste of the Wild Appalachian Valley Small Breed Canine Recipe with Venison & Garbanzo Beans Grain-Free Dry Dog Food
Protein 32%
Fat 18%
Starch 30%
Compare these two in full
Taste of the Wild Appalachian Valley Small Breed Canine Recipe with Venison & Garbanzo Beans Grain-Free Dry Dog Food
Protein 32%
Fat 18%
Starch 30%
Compare these two in full
Which Fits Your Dog
- For an active or working dog, or one that needs to hold muscle, Orijen puts more protein in each bowl.
- For a dog that gains weight easily, Taste of the Wild is less calorie dense, so a normal-looking portion carries fewer calories.
- If you are cutting back on starch, Orijen starts lower.
Recall History
FDA recall notices from the last five years that name the brand or its maker. Older notices sit in each brand's archive below: still on the record, but not counted, since a recall that old says more about how a company used to run than how it runs now.
Orijen
No FDA recalls in our record for Orijen in the last five years.
Taste of the Wild
No FDA recalls in our record for Taste of the Wild in the last five years.
Archive: 1 older recall
Chicken Soup for the Pet Lover's Soul; Country Value; Diamond; Diamond Naturals; Premium Edge; Professional; 4Health; Taste of the Wild; Kirkland Signature. Expansion to batches of nine brands of dry dog and cat food made at Gaston, SC plant Dec 9 2011 - Apr 7 2012
About the Brands
Orijen
Orijen is a premium dog and cat food brand made by Champion Petfoods, which also makes Acana. The brand is known for high-protein recipes, and the company says its foods are built around WholePrey ingredients such as meat, organs and bone.
Based in Edmonton, Alberta, since 2005. Every Orijen food we review
Taste of the Wild
Taste of the Wild is a dry and wet dog and cat food brand owned by Diamond Pet Foods, the trade name of Schell & Kampeter, Inc. of Meta, Missouri. The brand says its recipes are based on a pet's ancestral diet and it is known for less common proteins such as bison, venison, wild boar and trout. Its lines include the original grain-free recipes, Ancient Grains, and PREY limited ingredient recipes.
Based in Meta, Missouri, since 2007. Every Taste of the Wild food we review
More Brand Comparisons
How we compare: every figure comes from the guaranteed analysis and ingredient list of recipes we review, not from the brands' own claims. Starch is our estimate, since no manufacturer prints it. Figures refreshed October 20, 2026.
Think You Know What Your Dog Can Eat?
Ten everyday foods. Safe, In Moderation or Never. No googling, no second guesses. Then share your score with your friends, however embarrassing it turns out to be.
115 foods in the deck. Grapes are in there. So is cheese.
Think You
Know?
Ten foods, one at a time. Call each one Safe, In Moderation or Never, then flip the card to see if you had it right. The ones you miss are listed at the end.
Keys: 1 Safe 2 Moderation 3 Never Enter Next
Copied. Paste it anywhere your friends will see it.
Want the reason behind every answer? The 80-page e-book, $7.99
Now, is your dog's food any good?
Look it up: estimated starch, calories per cup and every ingredient, for 3,128 foods.